§ 01When print() isn't an option, the hardware itself becomes your display
§ 02What You Actually Have to Work With
Embedded debugging has a fundamental problem: the thing under test has no monitor, no shell, no log file. Your code runs inside a sealed box, and if it misbehaves, the usual feedback loop — run it, read the error, fix it — simply doesn't exist. Instead you learn to make the hardware speak for itself, using a small set of tools that reward methodical thinking far more than inspired guessing.
 Enlarge ⤢
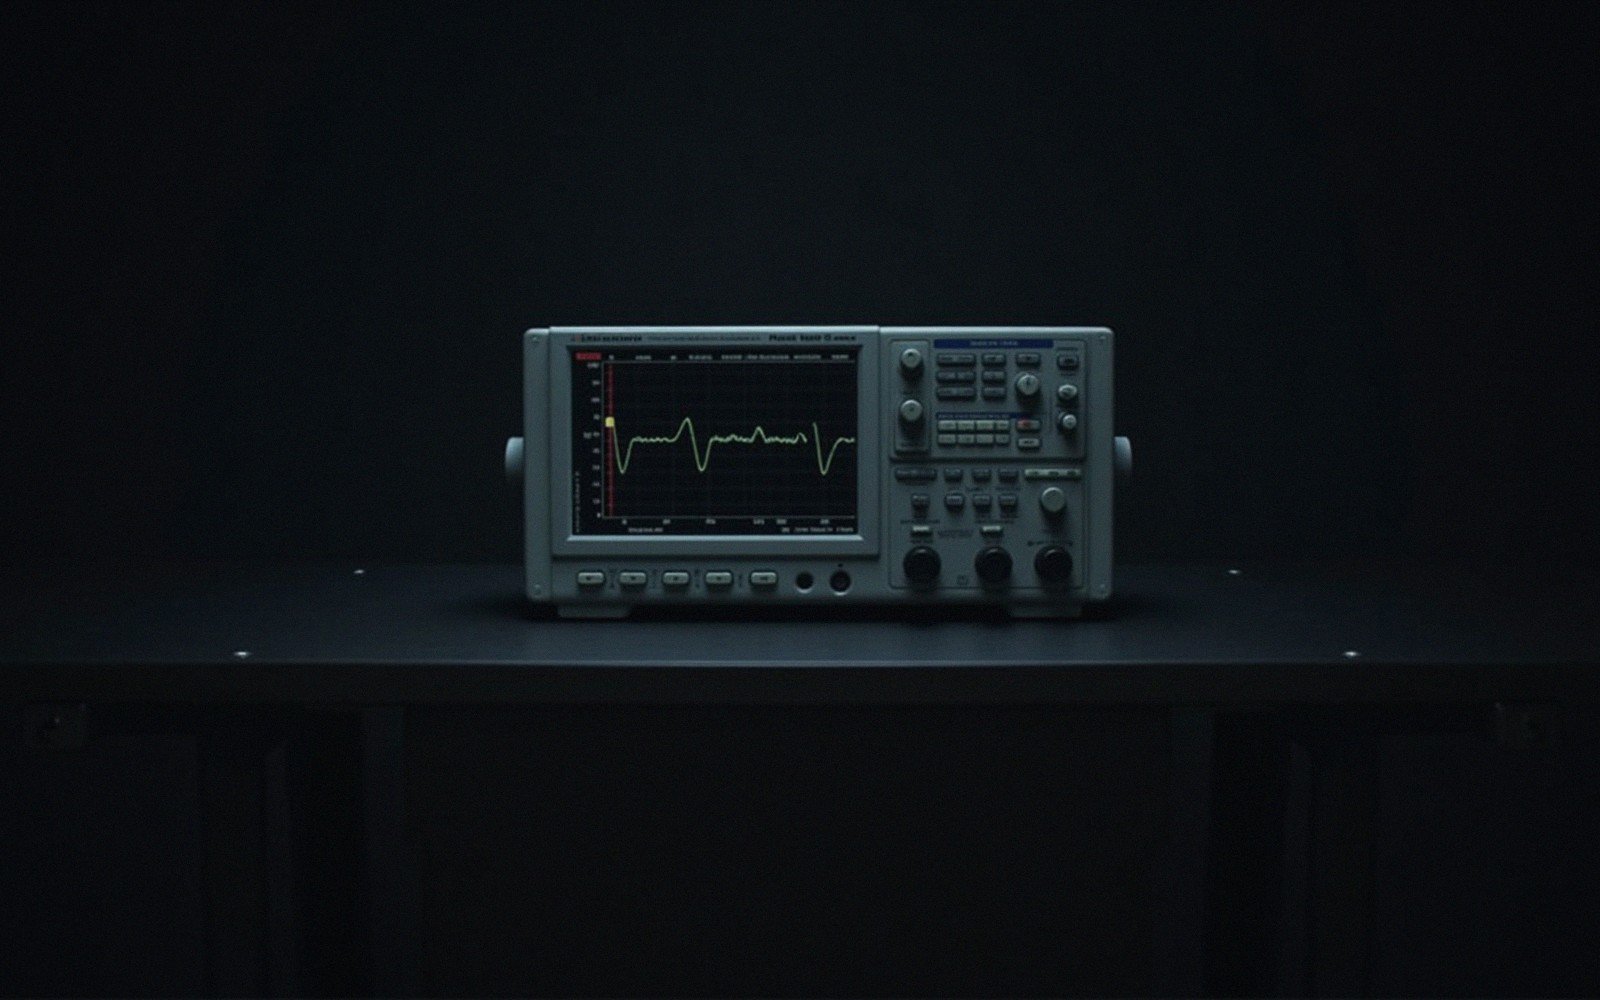
The good news is that the tools are genuinely powerful. A hardware debugger with breakpoint support lets you freeze a running microcontroller mid-instruction and inspect every register and memory location; a logic analyser can capture minutes of digital traffic and play it back at leisure; and a single spare GPIO pin, toggled at the right moment, can answer timing questions that no amount of staring at source code ever will. The bad news is that each tool has a mode of failure that fools you if you don't know it's there. Knowing the failure modes matters as much as knowing the feature.[1]
§ 03Breakpoints, Watch Windows, and the Frozen Clock Problem
A hardware debugger — connected over JTAG or SWD — gives you the most complete view of any debugging environment: you can set a breakpoint on any instruction, halt the core, and read every register and RAM cell in the system. An IDE watch window sits on top of that: it shows named variables in plain language, updated each time you halt or step, and it saves you from decoding hex by hand. This is, in most cases, the first tool you should reach for.
But breakpoints have a side effect that surprises almost every first-time embedded developer: when the core halts, time keeps moving. Timers keep counting. DMA transfers keep firing. An RTOS scheduler tick keeps incrementing. Any peripheral whose behaviour depends on something happening within a bounded time window — a UART receiver, a motor controller, a sensor polling loop — may be in a completely different state by the time you resume. Worse, some faults only exist as transient conditions; the moment you halt, the symptom disappears and the system looks perfectly healthy.
The practical response is to use breakpoints for logic problems — wrong branch, uninitialized variable, incorrect state machine transition — and reach for other techniques the moment timing enters the picture. Conditional breakpoints help: you can halt only when a variable crosses a threshold, catching the single bad iteration out of thousands without freezing the system on every pass. Hardware-assisted data watchpoints, where the core halts only on a write to a specific address, are similarly surgical. But for anything where the act of stopping changes what you're measuring, you need a different approach entirely.
Some debuggers offer a trace buffer: a small on-chip FIFO that records instruction addresses as the processor runs, without halting it. ARM's Embedded Trace Macrocell, present on many Cortex-M3 and higher cores, feeds this data out over a dedicated trace port. If your hardware exposes the trace pins and your debugger supports it, this is exceptionally powerful — you get a history of execution without touching timing. In practice, many boards don't expose trace pins, and the few that do require a debugger that can capture them. Know what you have before you count on it.[2]
§ 04The Spare Pin and the Logic Analyser
The oldest embedded debugging technique is also one of the most reliable: toggle a GPIO at a known point in your code and watch it on an oscilloscope or logic analyser. The overhead is a single store instruction and maybe ten nanoseconds of latency. The cost is one pin and a few lines of code. The result is a precise, real-time signal that tells you whether a block of code was reached, how long it took, and whether the timing is correct — with zero impact on the core's execution flow.
In practice this means picking an unused pin, configuring it as a push-pull output, and wrapping the region you care about:
GPIO_set(DEBUG_PIN); do_the_thing(); GPIO_clear(DEBUG_PIN);
The high time on the pin is the execution time of do_the_thing(). If it's longer than expected, you have a timing problem. If it never goes high, you never reached that code. If it pulses erratically, your state machine has a branch you didn't expect. This is not elegant, but it is fast to instrument and the result is unambiguous.
A logic analyser extends this technique dramatically. Where a scope shows you one or two channels in real time, a logic analyser can capture eight, sixteen or more channels simultaneously, record them over seconds or minutes, and let you search the resulting trace for patterns. That means you can instrument multiple code paths in parallel, log them all in one capture, and reconstruct the sequence of events after the fact. The low end of the market — USB analysers built around Cypress FX2 silicon and running open-source firmware — costs very little and works adequately for most SPI, I2C and UART traffic at speeds up to a few megahertz. Higher-speed or more complex protocols need more bandwidth and proper triggering, but for workbench debugging of a peripheral that isn't responding correctly, the cheap analyser and a decoder in software is usually enough.
The same logic analyser can decode those protocols directly. Most PC-side analysis software includes protocol decoders: point it at the right channels, tell it the clock speed, and it will annotate every byte of SPI traffic or every I2C transaction in your trace. This turns a confusing series of transitions into a readable log of what the microcontroller actually sent and what the peripheral actually replied — which is almost always more informative than re-reading the datasheet for the third time.
§ 05Putting It Together
None of these tools works in isolation. The workflow that pays off is to use them in sequence: start with the debugger and watch windows to understand the logic, verify that state machines and data structures behave as intended. Once logic is confirmed, move to pin-toggling to get timing data without disturbing the system. If the fault involves a peripheral or bus, add the logic analyser and compare the captured traffic against the protocol specification. Each layer narrows the search space.
The other discipline worth building early is separating the symptom from the fault. A UART that outputs garbage might mean wrong baud rate, wrong clock configuration, a buffer overrun, or a framing error — the same symptom, four different causes. The debugger tells you which path executed; the pin toggle tells you when; the logic analyser tells you what went across the wire. Together they produce the kind of evidence that points to a single cause rather than a shortlist.
The screen you don't have is replaced, adequately, by the evidence you learn to collect.